

Diagram In Depth
Create deep, interactive diagrams to document and explain your systems with unparalleled clarity and detail.
Ilograph is available online, on-prem, and in Confluence Cloud.


Communicate your system architecture like never before
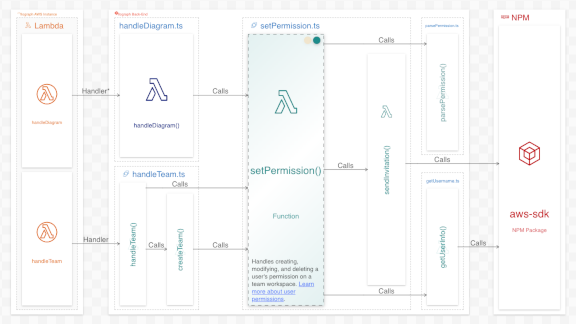
Create detailed visual documentation — from broad system overviews to specific component interactions. Zoom in to examine individual components or zoom out to display the entire system.
Establish a shared understanding
Keep everyone on the team aligned with a shared understanding of your systems. Ground discussions with a shared visual model to streamline discussions, shorten meetings, and prevent costly misunderstandings.
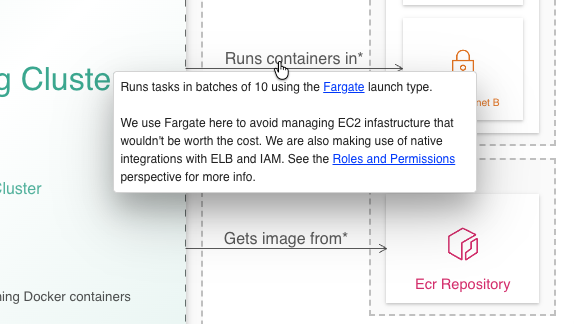
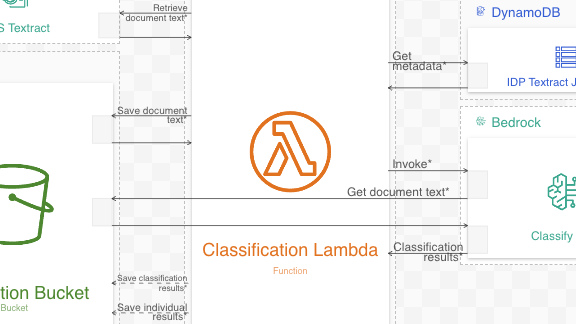
Highlight mission-critical flows
Use interactive, zoomable sequence diagrams to highlight key data, business, and security flows.

Ilograph Is the Best Diagramming Tool for Communicating Complex Distributed Systems
As a software engineer of complex distributed systems, I think about these systems at many levels of abstractions. I spent a lot of time with various diagramming tools that enabled me to communicate how these systems worked and interacted and have found Ilograph to be the best.
Why System Engineers Love Ilograph
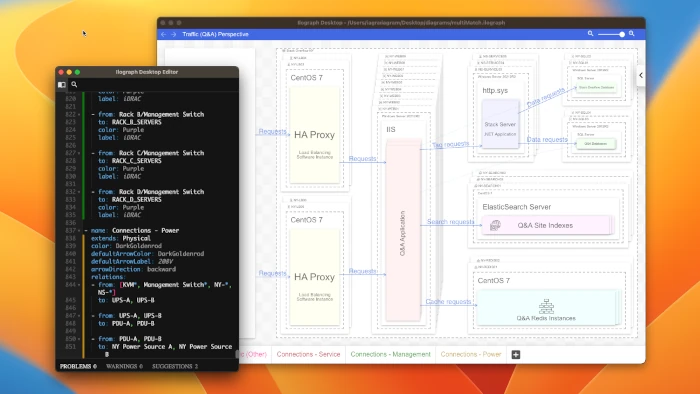
Diagrams-as-code with autocompelete
Ilograph's lightweight, model-based approach makes it quick and easy to create and update diagrams. Unlike other diagrams-as-code tools, Ilograph offers full autocomplete and updates instantly as you type.
Automatic layouts
Save time and effort with Ilograph's beautiful and intuitive automatic layouts.
Meets you where you are
Collaborate on Ilograph diagrams online, on-prem, and in Confluence Cloud.


Is Ilograph right for your team?
Try now for free