

The Two Fundamental Types of Architecture Diagrams

There are two fundamental types of architecture diagrams from which all others derive. Together, they form a duality; their purposes and capabilities are opposite and complementary. Understanding both is critical for creating clear, informative, and relevant architecture diagrams for technical systems.
First, what is an architecture diagram?
Before continuing, we must first define “architecture diagram.” According to alibabcloud
“An architectural diagram is a system diagram used to abstract the overall outline of the software system and the relationships, constraints, and boundaries between components.”
Components are commonly understood to be discrete, tangible, and bounded resources that provide value to a system. Although their importance may vary, systems require components to run correctly.
By this definition, components include machines, artifacts, services, repositories, databases, classes, functions, teams, and people, among many others. It excludes intangible things like decisions, use cases, states, and actions, as well as indiscrete resources like money and time.
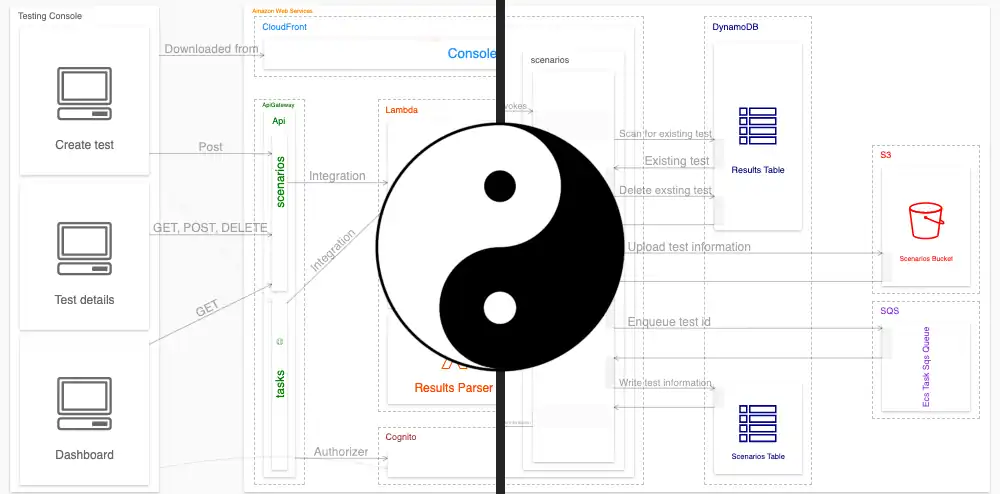
An architecture diagram of a distributed load testing system running on Amazon Web Services
We’re limiting the definition of architecture diagrams to only those that include components as defined above. This restriction excludes popular (and valuable) diagrams like flow charts and state machine diagrams. We do this to limit the scope of this article, but it is also in line with the commonly (if vaguely) understood meaning of “architecture diagram.”
Relation diagrams
Relation diagrams describe the invariant relations between components in a system - relations between components that are always true. Common relations include dependency, ownership, belonging, utilization, and capability. Relation diagrams come in many forms but are usually as simple as boxes (components) with labeled arrows going between them (relations).
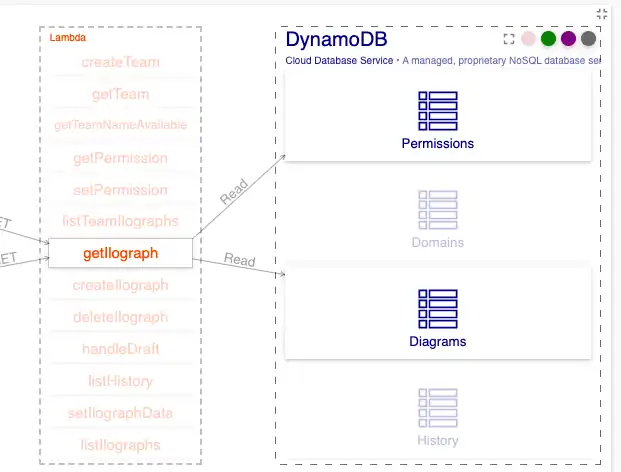
“Lambda getIlograph reads from DynamoDB table Permissions” is an example of an invariant relation. The below diagram doesn’t detail when or how getIlograph reads from Permissions. It merely tells us that the relation between these components exists:
Relation diagrams are static. Unlike sequence diagrams (discussed below), there is no “arrow of time.” The diagrams need not be read in any order and have no start or end.
Describing these relations visually in a diagram offers benefits over describing them in text. Viewers can quickly trace the relations in the diagram to find transitive relations. If another resource X invokes Lambda getIlograph, then X has a transitive relation on DynamoDB table Permissions. Finding such transitive relations is easier in a diagram than in text:
Note that these transitive relations can extend multiple levels and cross-context layers.
Additionally, when viewed as a diagram, the viewer quickly reads the scope of these relations. If the diagram includes contextual elements, it unobtrusively conveys this information.
What does “always true” mean?
“Always true” should really be “always true from a given perspective.” For example, when diagramming dependency relations of a system, we can (and should) split up run-time dependencies and deploy-time dependencies. By doing this, we separate relations that are “always true” when deploying an architecture from those that are “always true” when the architecture is running.
To take an example, at deploy time, a deployment pipeline may have dependencies on package registries (npmjs, pypi), container image libraries (Docker Hub), code repositories (in, say, GitHub), and the like. However, those dependencies do not (usually) exist at run time. GitHub going down would not affect a system that has already been deployed, for instance, and splitting up run-time and deploy-time dependencies allows you to convey this explicitly:
This example illustrates the general need for multiple relation diagrams, one for each perspective of a system. Medium-sized systems could include a half-dozen perspectives. Perspectives could show component relations from security, physical, team, and other points of view. You can even have separate perspectives for a system’s current and future state(s) if it is under active development.
Sequence diagrams
Sequence diagrams are distinct from and complementary to relation diagrams. While relation diagrams show how components are statically related, sequence diagrams show how components dynamically interact.
Sequence diagrams show what happens between components, when, and how. For example, while the relation diagram above indicates that Lambda getIlograph reads from DynamoDB, a sequence diagram shows examples of when this happens.
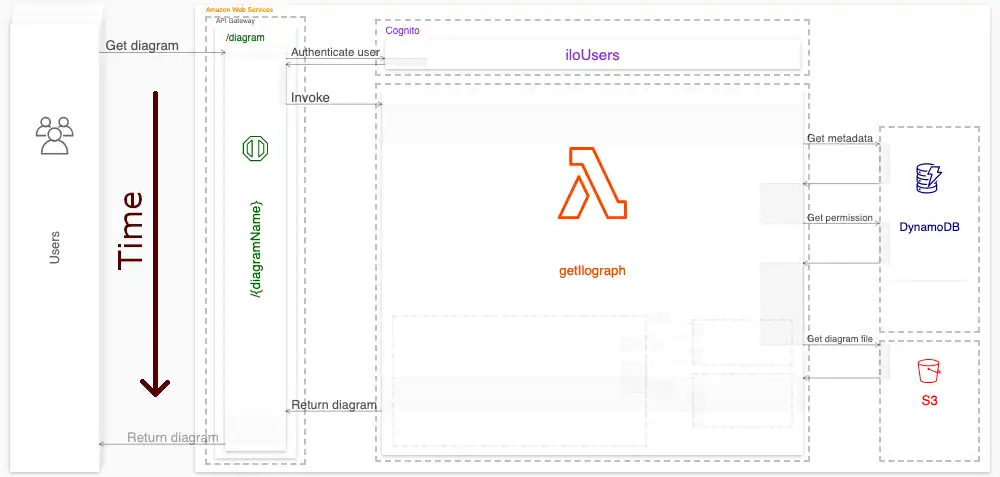
In this example sequence diagram (which is a kind of UML diagram), we see some of the same components as in the relation diagram. It shows us the system performing a specific activity: retrieving an Ilograph diagram from S3. The diagram shows us what components are involved, how they interact, and in what order those interactions happen.
While relation diagrams give components static context, sequence diagrams give them temporal context. They show what happens before and after key interactions between components.
Unlike (static) relation diagrams, sequence diagrams “have an arrow of time.” They are read in a particular order and have a start and an end. One reads them like a book: left-to-right and top-to-bottom (when written in left-to-right languages).
Sequence diagrams are generally lower-level and more detailed than relation diagrams. Just like with relation diagrams, however, the level of detail can vary:
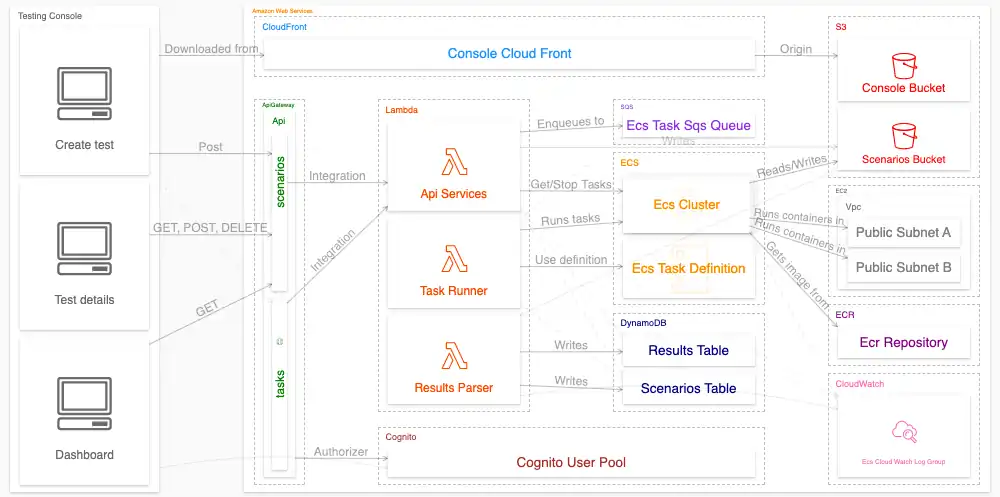
Critically, like with relation diagrams, there are many possible sequence perspectives for a given system. Probably dozens of valuable interactions can be diagrammed in a medium-sized project. The example below switches between five sequence diagrams of a single system (creating a test, executing a test, writing test results, listing running tests, and canceling a test):
Working together
Relation diagrams and sequence diagrams complement one another. What one can’t show well, the other typically can. A generous mix of relational and sequence diagrams can thoroughly document an architecture for most projects. A half-dozen or so relation diagrams, and at least that many sequence diagrams, is a good goal for a medium-sized system.
Questions or comments? Please reach out to me by email at billy@ilograph.com.