

How to Generate AWS Diagrams with Resource Explorer and Ilograph

Welcome. This article shows how to generate architecture diagrams from resources in an AWS account (or multiple accounts). The techniques used here make use of only free tools and don’t require giving access to your AWS account(s). The diagrams will be interactive and show the resources from multiple perspectives:
Along with source code and written documentation, system architecture diagrams are excellent tools for documentation, onboarding, and knowledge-sharing. Viewers can quickly scan architecture diagrams to ascertain the system’s scope, scale, and patterns. Diagrams documenting actual systems (such as those deployed to AWS) are especially valuable.
This guide uses two free tools:
- AWS Resource Explorer to export resources from an AWS account. Resource Explorer is free to use.
- Ilograph to import the resources and generate diagrams with them. Everything described here can be done using the free online version of Ilograph, regardless of the size and scope of the diagrammed AWS account(s). You can also use Ilograph Desktop or Ilograph for Confluence (both paid) if preferred.
Note that the process will not be completely automated. These tools can generate significant portions of the diagrams (Parts 1 and 2), but human knowledge will be needed to diagram a system fully (Parts 3 and 4).
Part 1: Exporting resource data using AWS Resource Explorer
The first step is to export information about your AWS account’s resources using AWS Resource Explorer. These resources can include EC2 instances, DynamoDB tables, and IAM roles. Even simple architectures deployed to AWS can have a surprisingly large number of resources. In Part 2, you will import these resources into Ilograph to visualize them.
The sample diagrams used throughout this article are based on a deployment of the Generative AI Application Builder on AWS solution. Click here to view them.
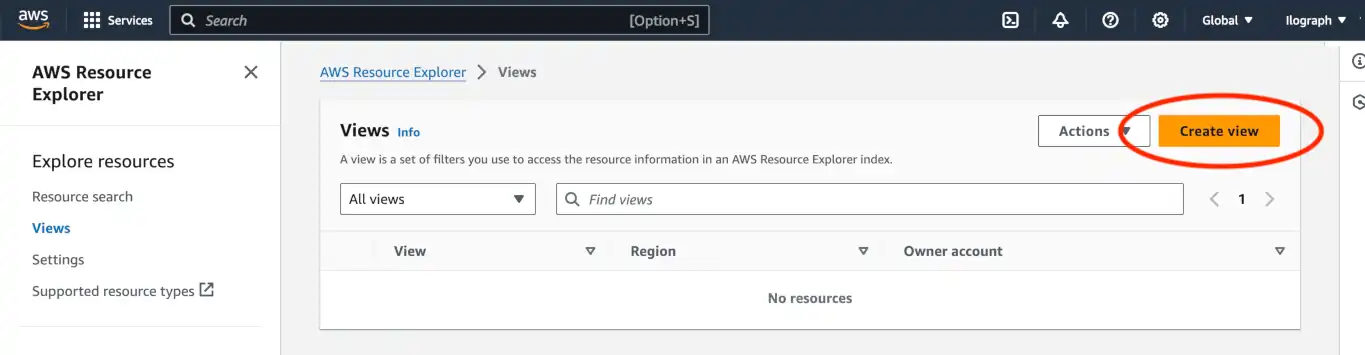
To begin, click here to open the “Views” page in Resource Explorer. If there are no views already, click the orange “Create View” button:
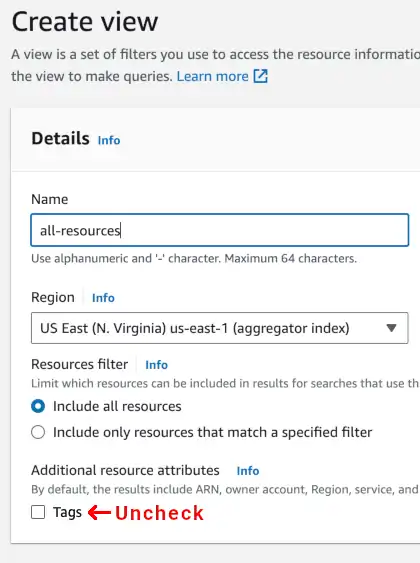
Give the view a name (here, I’ve chosen “all-resources”) and leave the filter setting on “Include all resources”. Be sure to un-check the “Tags” checkbox. Exporting tag attributes isn’t necessary and can slow down the time it takes to export resources.
When ready, click the “Create View” button at the bottom of the page, then navigate to the resource search page. Resources should begin appearing in the table. Depending on the number and type of resources in the account, it can take several minutes to an hour for all resources to appear.
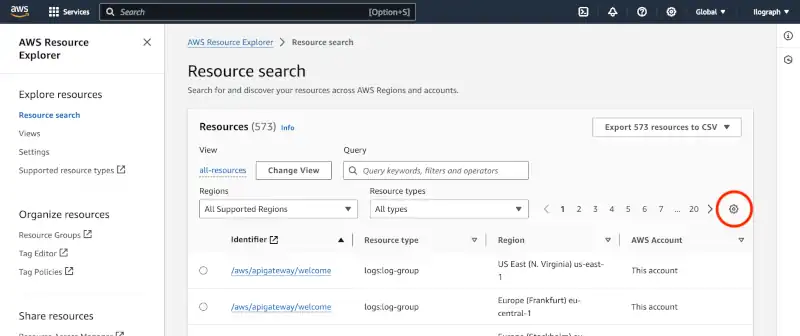
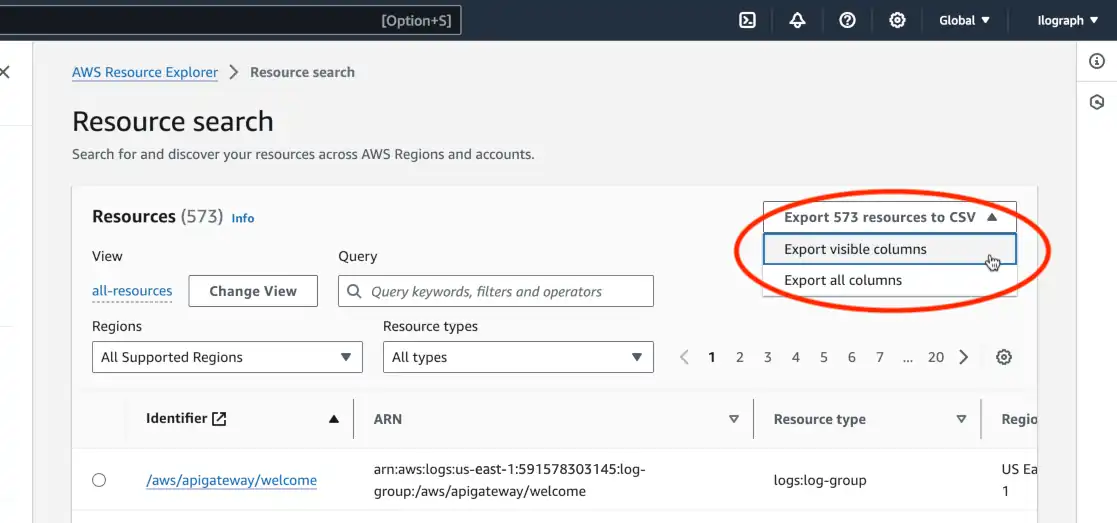
Once all the resources are present, select the gear icon to customize the columns in the resource table. The visible columns will determine what resources get exported to the CSV file:
In the preferences pop-up, ensure that Identifier, Resource Type, Region, and AWS Account are selected. These are required for the import to work in the next part:
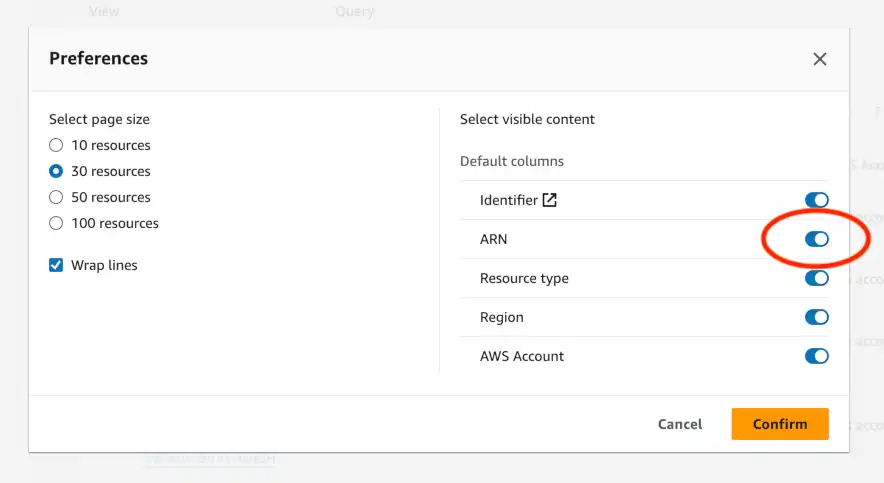
Optionally, you may include ARN (Amazon Resource Name) as an exported column. By including this field in the export, resources in the generated diagrams will have links back to their location in the AWS console.
Confirming your choices returns you to the view screen. From there, export all visible columns using the dropdown in the top-right of the page:
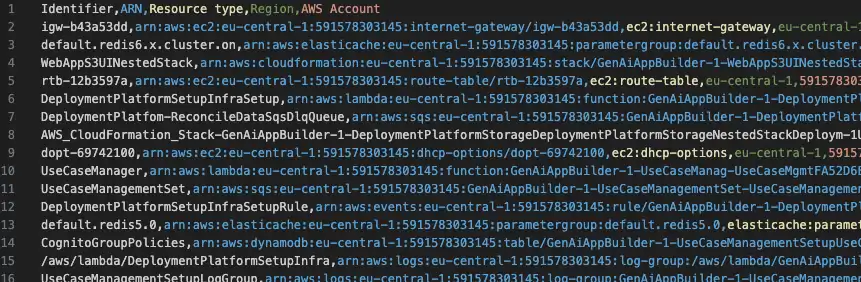
In the exported to a CSV, each line contains the ID, type, region, AWS account number, and optionally, ARN of a resource:
The above steps cover exporting resources from a single AWS account. Repeat the steps above for each account to export from multiple AWS accounts, then combine the fields into one CSV file. Ensure the combined CSV file has only one header (the first line of the CSV).
Is this data sensitive? Not really. None of these fields contain passwords or keys, and ARNs are not considered secrets. Bad actors won’t be able to use this information without first compromising the AWS account.
With the resources exported, it is time for the second step: importing them into Ilograph.
Part 2: Importing resources into Ilograph
In this section, you will copy the exported data into Ilograph, explore your resources, and optionally rename them and create new ones.
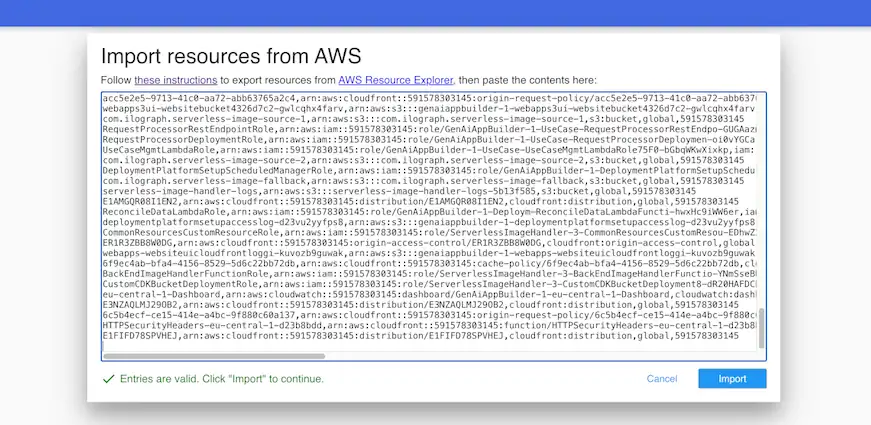
To begin, click here to open the AWS resource importer in Ilograph. The app will greet you with a textbox inviting you to paste the CSV data created in Part 1. Paste in the data, including the header information in the first line. If everything works as expected, the blue “Import” button will become available:
Browsing your resources
Once imported, your AWS resources will appear as boxes (also called resources) in Ilograph:
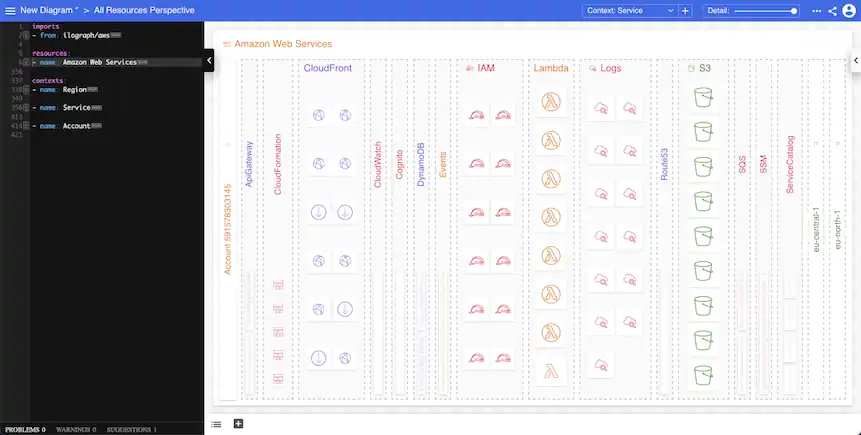
The number and type of resources, and how they appear, will vary greatly depending on how many there are.
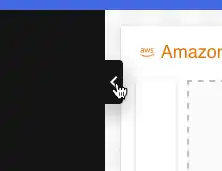
You won’t be editing right away, so to give yourself more space, close the editor window on the left by clicking this black tab:
By default, the resources appear in their respective AWS services. This layout can be changed using the “Context” dropdown in the app’s top-right corner:
Available options include sorting by service, region, and account. Depending on the number of regions and accounts in your solution, these layouts will be more or less enlightening.
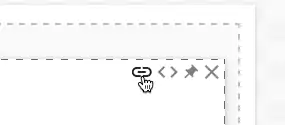
Returning to the “Service” context, you can click on a service to see all resources in that service. You can also click on the resources themselves:
When selected, some resources will have links back to the resource in the AWS console. These appear if resource ARNs were exported and included in the CSV file (see Part 1 above):
To find a specific resource by name, type Ctrl-F (Cmd-F on Mac) to open the find window. This find function is convenient when browsing accounts with many resources:
Renaming resources (Optional)
Resources exported from Resource Explorer don’t always have human-friendly identifiers. To rename a resource, follow these steps:
First, reopen up the editor using the black tab on the left edge of the app window:
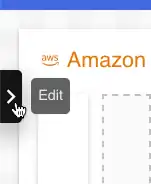
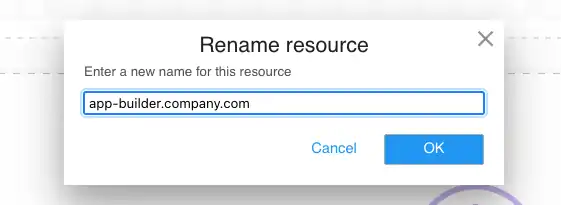
Select the resource you’d like to rename, then click the “edit” icon (the pencil) by its name:
Enter a more human-friendly name in the textbox, then click “OK” to finish renaming.
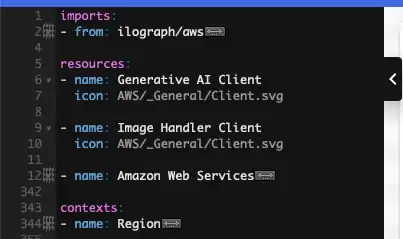
Adding resources (Optional)
You may add resources that were not part of the original export. To do so, add them to the “resources” section in the editor on the left. In the example below, two “client” resources have been added; they will be used in examples in the next section.
Note that you can rename and add resources at any time.
Part 3: Showing relations between resources
With the resources imported into Ilograph, you can now start creating perspectives with them. Perspectives are views of resources showing how they are related (relation perspectives) or interact with each other (sequence perspectives). You will create relation perspectives in this part and sequence perspectives in Part 4.
Until now, you did not need direct knowledge of the solution. From this point forward, you will need first-hand knowledge of the system(s) you are diagramming.
Relation Perspective 1: Run-time dependencies
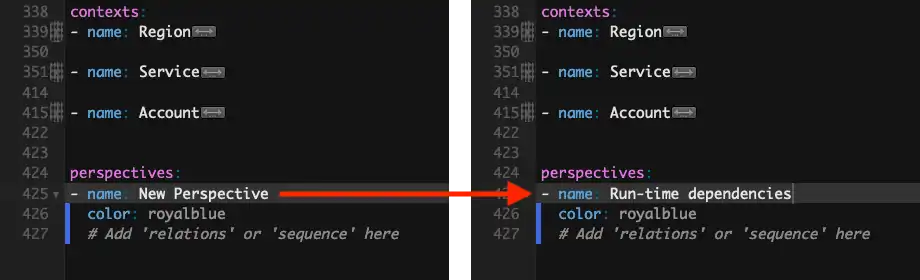
To add a new perspective, first reopen the editor if it isn’t already open. Then click the “New perspective” button in the bottom tray of the application:

In the editor, a new section called “perspectives” is added with a new perspective (called, naturally, “New Perspective”). Change the name of this perspective to “Run-time dependencies”:
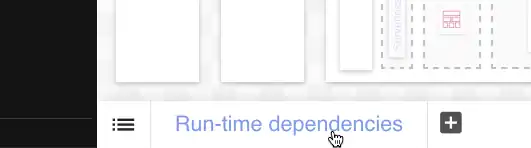
Back in the tray, click on the perspective name to select it:
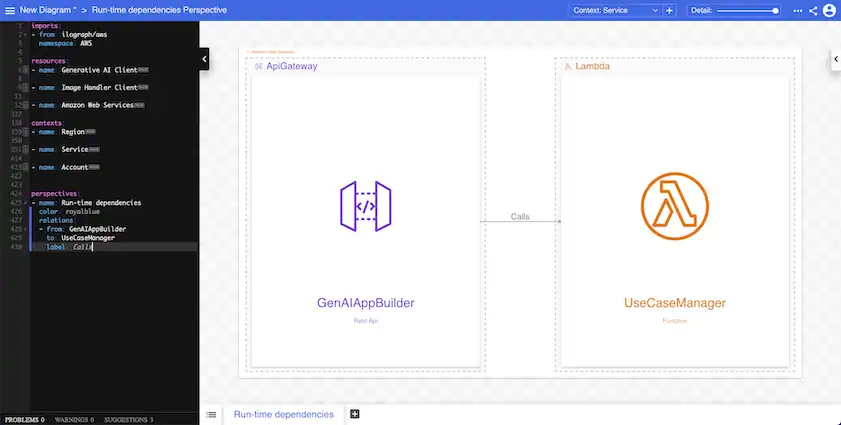
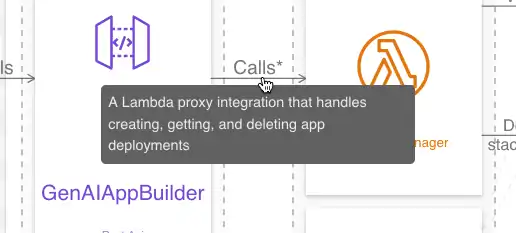
The perspective is initially empty. To populate it, consider the most essential run-time relations between your resources. For example, your system might have a REST API (GenAIAppBuilder) which calls a Lambda function (UseCaseManager). Add this relation from GenAIAppBuilder to UseCaseManager to the relations section of the perspective:
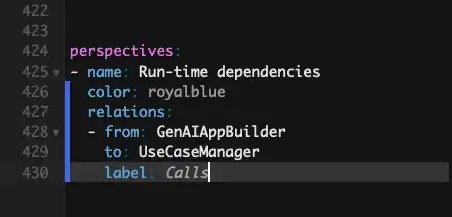
The perspective should now look like this:
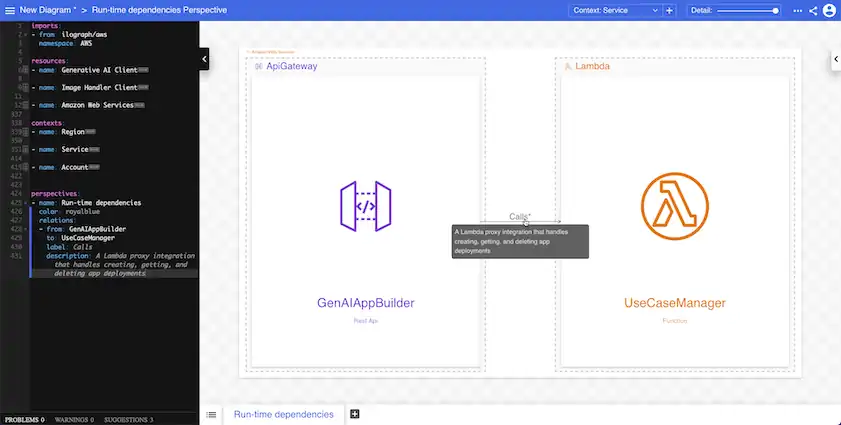
You may want to say more about this relation; do so by adding a “description” to it that will appear on mouse-over:
The lambda likely has downstream dependencies at run-time. For example, it may read from and write to a DynamoDB database. Add this as a second relation:
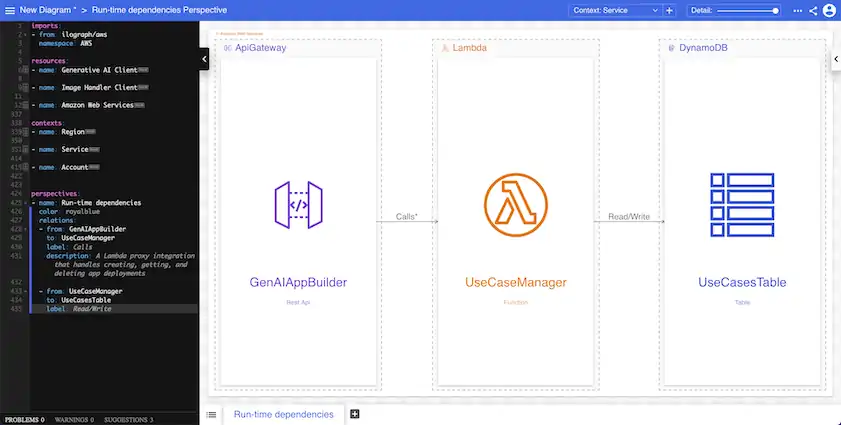
Continue to add run-time relations. If your AWS account contains multiple independent systems, consider breaking them up into multiple perspectives. The example below shows relations between the API, lambdas, and other downstream dependencies:
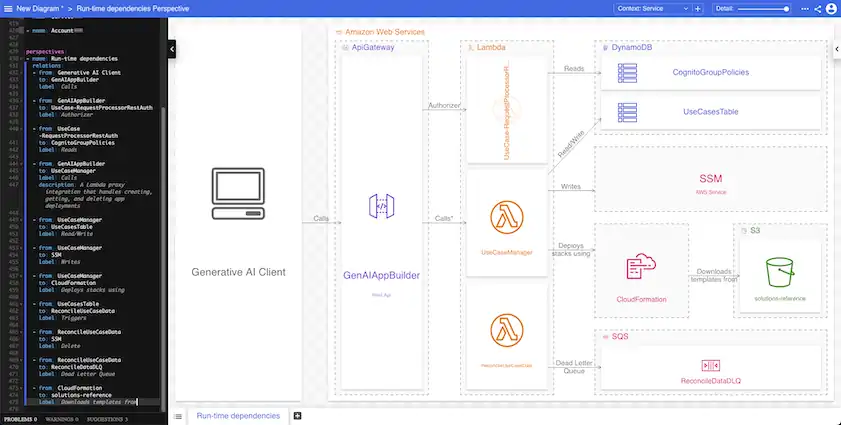
This perspective shows how these resources are related but not their exact interactions. You will document these in Part 4.
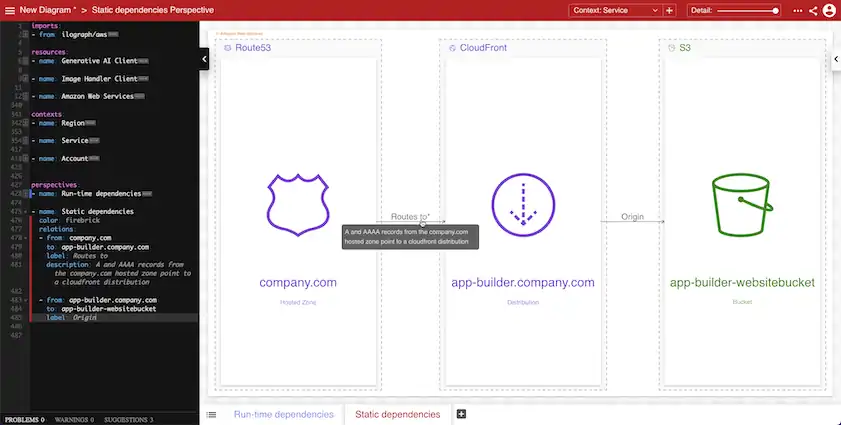
Relation Perspective 2: Static dependencies
The previous perspective focuses on run-time perspectives; it does not show static relations related to DNS and CloudFront origins. Instead of adding these relations to this perspective, create a new perspective dedicated to these relations.
Use the “New perspective” button again to create a new perspective, then name it “Static dependencies.” Add relations like before to document how your resources are configured regarding DNS (Route53), CDN (CloudFront), and similar technologies. Avoid adding dynamic run-time relations (better suited to the previous perspective) or build-time relations (better suited to the following perspective).
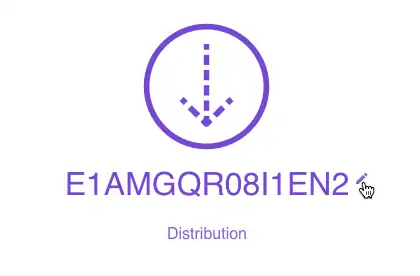
For example, users may use a static website hosted in an S3 bucket and accessed from a CloudFront distribution. This distribution uses a Route53 hosted zone for DNS resolution:
Continue to add static dependency relations. Like before, you can break these into multiple perspectives if you have a large account with multiple independent systems:
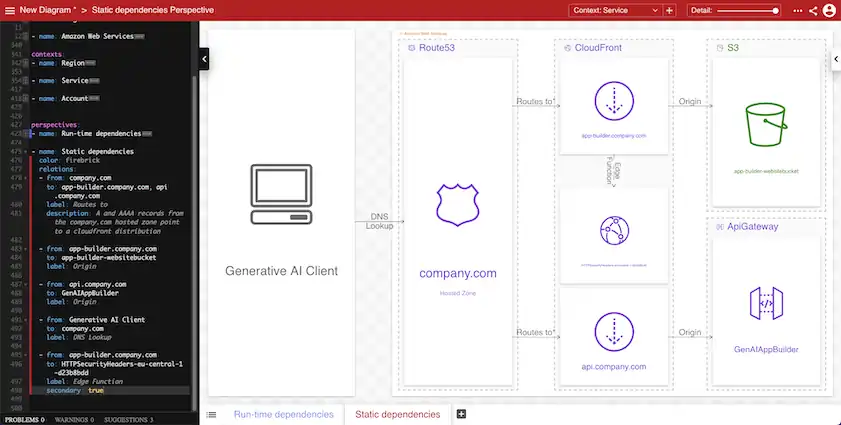
Notice that GenAIAppBuilder is present in both perspectives in our example:
Relation Perspective 3: Deployment
The final relational perspective covered in this guide concerns build-time relations. In addition to run-time and static dependencies, your audience may want to know how your resources were deployed. Create a Deployment perspective to cover this; an example looks like this:
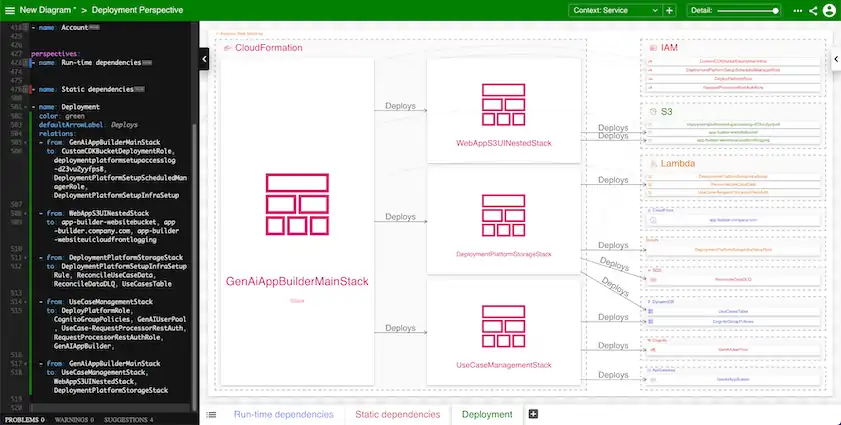
This example perspective shows which resources were deployed by which CloudFormation stacks. Selecting a stack focuses on the resources it was responsible for deploying:
Like before, you can toggle between this perspective and the others to see their commonalities:
Part 4: Showing interactions between resources
Part 3 covered relational perspectives, which showed, at a high level, how your AWS resources are related. Part 4 focuses on sequence perspectives, which show interactions between your resources. Sequence perspectives are generally more detailed and excellent for explaining exactly how critical functionality works.
The exact interactions between your AWS resources are, of course, particular to what your system does. Instead of prescribing perspectives like in Part 3, we will switch gears and look at two example sequence perspectives.
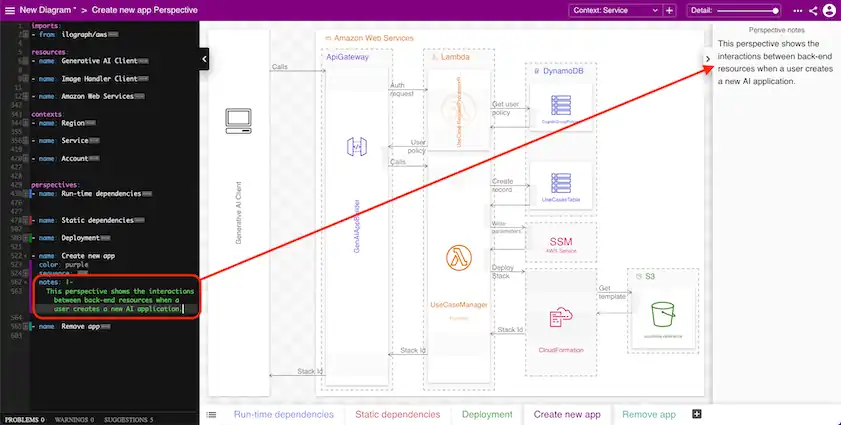
Example Sequence Perspective 1: Deploying a new app
The Run-time dependencies perspective created in Part 3 shows that the UseCaseManager Lambda function writes to the UseCaseTable DynamoDB table and deploys stacks using CloudFormation. This high-level information is valuable, but it would be valueable to demonstrate when and why these things happen.
The Generative AI Application Builder solution allows users to deploy (and delete) AI apps. We will create two sequence perspectives to show how our resources interact in these two scenarios. The first perspective, “Create new app,” shows what these resources do when users deploy a new app:
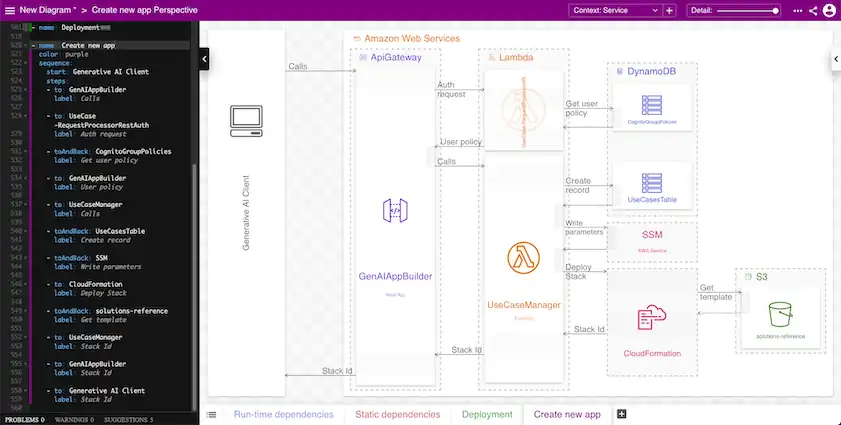
While perspectives in Part 3 defined “relations” in the editor window, the perspective defines a sequence:
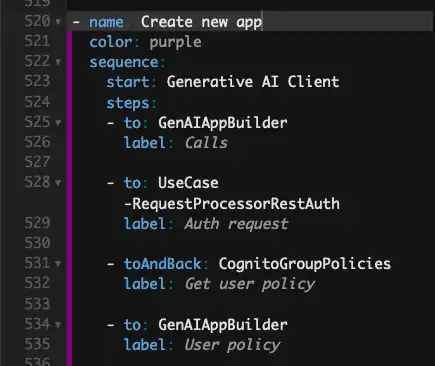
The syntax of sequence diagrams should be easy enough to understand. Each step defines a resource and a label for the arrow.
Unlike the Run-time dependencies perspective, the sequence perspective shows the detailed back-and-forth between resources, including the order of operations. However, this perspective covers only a single interaction. We need other sequence perspectives to show different scenarios.
Example Sequence Perspective 2: Removing an app
Our first sequence perspective showed how creating an app works. Our second shows the opposite action, removing an app:
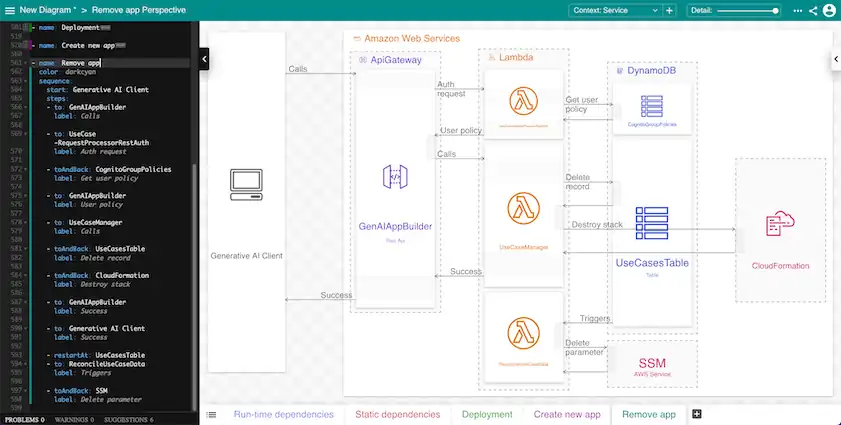
Our resources are mostly the same in this scenario. Toggling between our two sequence perspectives and the run-time dependencies perspective emphasizes how they are different views on (mostly) the same resources:
Small systems may have only a few paths of functionality; larger systems may have hundreds or more. Consider documenting the most important critical functional paths with sequence perspectives.
Addendum: Adding more details
Ilograph provides a few additional ways to enrich your diagram with more information:
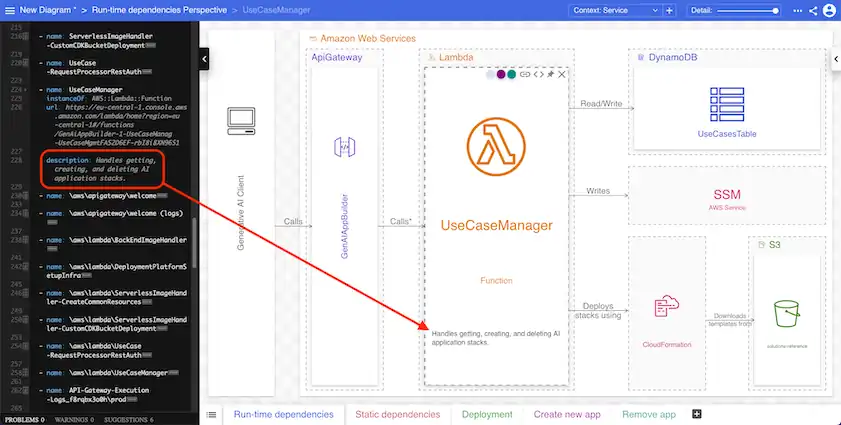
Resource descriptions - Descriptions can be added to each resource to provide more information about them. The description is visible when the resource is selected:
Relation and step descriptions - Every step and relation can also be given a description. These appear on mouse-over:
Perspective notes - Notes can be added to perspectives. These are excellent for orienting new viewers to what the perspective is showing:
If you haven’t already, click here to view the sample diagrams used throughout this article.
Questions or comments? Please reach out to me on LinkedIn or by email at billy@ilograph.com.