

It’s Time to Drop Drag-and-Drop Architecture Diagramming

Late last week, Google Cloud released an architecture diagramming tool for its service. While its stable of developer advocates were predictably excited beyond all rationality, the tool itself doesn’t feel like a meaningful improvement over the technology it is built on (Excalidraw). Simon Brown, the creator of the C4 model, made a broader point on its shortcomings:
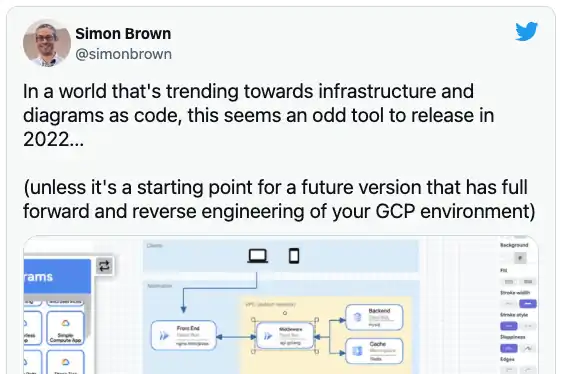
His criticism, while not detailed, is spot-on. The world did not need another drag-and-drop diagramming tool, and in the 2020s these aren’t the right tools for creating architecture diagrams anyway. Here are the reasons why it’s time to drop drag-and-drop architecture diagramming:
Drag-and-drop diagrams are near-impossible to maintain
Almost all drag-and-drop diagramming tools tout how easy they are to use. Who doesn’t love easy, right? Just drag an icon to where you want it, add an arrow and a label (maybe), and boom! – instant system architecture diagram.
The fact is drag-and-drop tools are easy in one respect: they’re easy to get started with. You don’t have to create a model, learn a diagramming language, or really put much forethought into what you’re actually trying to convey in your diagram.
There is, however, one glaring and terrifying problem with “easy” you never hear about in marketing materials: it doesn’t scale. Time saved when getting started typically must be paid back later, and with interest. When using diagramming tools, this is felt most acutely when trying to add elements to an existing diagram. Consider, for example, adding more Elastic Load Balancers to this AWS diagram:
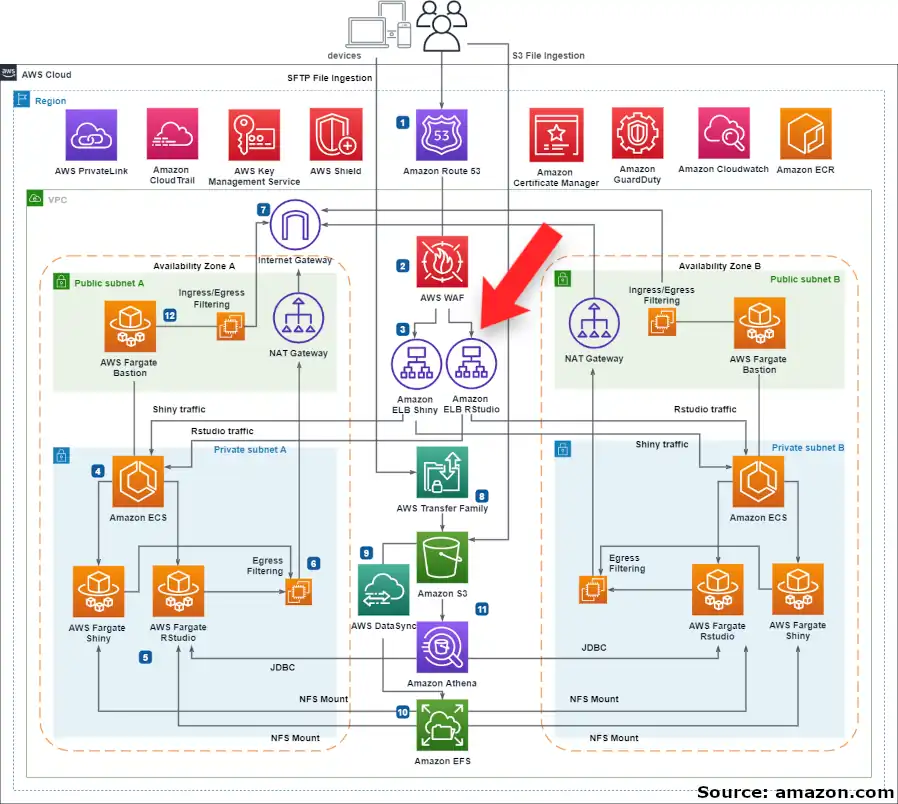
Adding just two more ELBs where the existing ones are would require considerable work. Nearly every icon, box, line, and line label in the diagram would need to be adjusted to make the necessary room. Some icons and labels might need to be resized or relocated entirely. This work could take an hour or more, and this is just one change. If we care about maintainability in our diagrams (and we should), then this isn’t acceptable.
The solution is to use a diagramming tool that automatically lays out your diagrams. Mermaid, plantUML, and Ilograph are all examples of diagrams-as-code tools that do exactly this. With auto-generated layouts, adding a resource to an existing diagram is just as easy as adding one to a new diagram:
Designing with change in mind is a hallmark of professional systems engineering, whether it’s for an entire architecture, a service, or a single class or module. Diagrams should be easily changeable to accommodate the changing world around them. Your diagramming tool needs to make that easy.
This is critical for the simplest of reasons: things that are hard to change don’t get changed. Diagrams are not exceptions. Because diagrams defined using code are easy to change, it is far easier to keep them up to date and relevant.
They lack focus and perspectives
With automatic layouts comes a tantalizing possibility: interactive diagrams with multiple perspectives. What if viewers could isolate parts of the diagram they’re interested in and see more relevant details? With traditional drag-and-drop diagrams, this is impossible. Using diagrams-as-code, it is a reality:
Niftiness aside, interactive diagrams allow you to include an incredible, possibly unlimited, amount of detail. When the goal is to truly inform (instead of merely make an impression) those details matter a lot.
They are not diff-able and merge-able
Because diagrams created with drag-and-drop tools must store coordinate data for each component in the diagram, moving these components around results in large changes to their machine-generated source files. These changes make it difficult if not impossible to diff and merge these diagrams as they evolve. For example, here is the saved output of a diagrams.net diagram file:
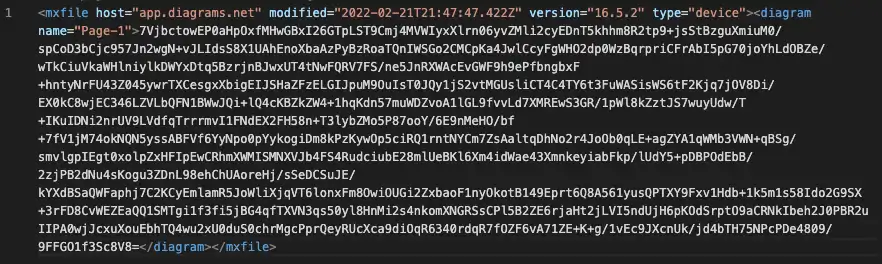
Diagrams defined in code do not suffer from this drawback. They are just as diff-able and merge-able as source code, and can be checked into version-control software like git.
Engineers prefer code
In the age of infrastructure-as-code and configuration-as-code (and, of course, regular old code) your engineering team is probably comfortable creating code-based deliverables. Most of your team members probably prefer it. As a bonus, diagrams-as-code languages are usually simple enough to learn in minutes.
When using drag-and-drop diagramming tools, a lot of time is often wasted fixing layout issues better left to the computer. Tools with automatic layout instead let engineers focus on the semantics of their diagrams. These tools require more up-front learning than drag-and-drop tools, but the potential long-term payoffs are huge. Quality engineers are happy to make these kinds of trade-offs.
–
Questions or comments? Please reach out to me by email at billy@ilograph.com.
Share this article on Facebook
Share this article on LinkedIn